Sure, looking at your camera’s LCD screen offers a glimpse at whether or not your image was drastically over or underexposed. But, when it comes down to whether or not the smallest details are beautifully intact or blown out into a white mass, a simple peek at the electronic viewfinder doesn’t cut it.
A histogram gives photographers a graphical representation of an image’s exposure by putting all the pixels on a chart. From helping photographers judge an exposure in the field to assisting the editing process, histograms can be a valuable — yet confusing — tool. Detangle the mystery with a step-by-step guide on how to read a histogram.
So, what is a histogram?

A histogram arranges all the pixels into a graphical representation based on brightness or color, with the darkest pixels or shadow detail on the left-side and the lightest pixels or highlight detail on the right side. Consider the histogram as a bar chart. Histograms give photographers a better idea on whether they have good exposure and if it’s necessary to further adjust the scene’s lighting. As you adjust your camera’s shutter speed, ISO and aperture you will see the information within this graph move.
A luminance histogram places all the pixels on a chart adjusted for human eyesight and accurately depict both pure white and pure black but otherwise doesn’t include color data. An RGB histogram, the one displayed in Lightroom as well as on most camera models, is a color histogram that includes color data so it’s simple to see if you want to adjust the green grass or the blue sky.
Step 1: Find the Histogram
Histograms are typically available inside any camera with manual modes, though the exact location varies based on whether you have a Canon, Nikon or other digital camera manuals. Histograms are typically accessible by accessing an image in preview and shifting through the view options with the arrow keys — you also may need to turn the feature on in the camera’s menu. On some models, the histogram is also offered in Live View. If you’re not sure, consult your camera’s manual.
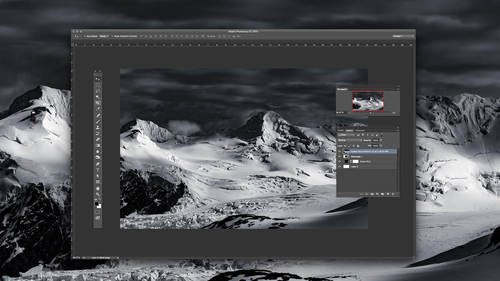
While editing, histograms can also be helpful — it’s that graph in the upper right corner of Lightroom’s Develop module. Or, you can access it in Photoshop from Window > Histogram.
Want to learn more Photoshop tutorials, techniques and tricks? Learn all the best shortcuts today.

Step 2: How to Read Histograms
With histograms arranging pixels from dark to light, what you need to look for first is to check to see if any of those pixels are cut off on either side (the right-hand side or left). If the pixels, whether just a few or large peaks, go off either the left or right edge of the histogram, the exposure is leaving out details that you won’t be able to recover in post-processing. (Be sure to
If the pixels are cut off on the left-hand side, your exposure is too dark — you’ve clipped, or left out, the dark areas or shadows.

If the pixels are cut off on the right-hand side, the exposure is too light and the highlight details in the brightest parts of the image are likely obscured.

Once you see clipping, adjust your exposure so that all the pixels are on the chart, like this:

Step 3: Evaluate the Tones
The edges of the histogram tell you if you have the correct exposure, but the rest of those peaks and valleys give you an idea of that photograph’s dynamic range, or the range of light that was captured. Adjusting the exposure will widen those peaks and change their location, but the histogram can also offer clues on whether you need to add more light into the scene.
With the pixels arranged from dark to light, the histogram also charts the image’s blacks, shadows, midtones, highlights and whites, with the blacks and whites being those extreme edges. Outside those edges, the histogram can tell you if your tones are evenly distributed. In even lighting conditions such as a cloudy day, the histogram will peak in the middle and tapper off on the sides, while on a sunny day, you’ll notice peaks in the highlights and shadows but fewer mid tone pixels.
For example, this histogram suggests that the highlight details are largely missing and that the photo contains lots of shadows and a few overexposed whites but not much in between:

That tells me that my camera isn’t capturing the dynamic range of the scene very well. So, I took that same scene and added a fill flash, then ended with a histogram that’s still missing a few tones but it looks like this:

The peaks in the histogram can offer clues as to how you could improve your image. If you’re missing the mid tones or have lots of dark areas, try adding a fill flash. If you have plenty of highlight peaks, try lowering the exposure of just the sky with a graduated neutral density filter. When those options aren’t available, using the high dynamic range technique is another option.
Of course, that’s all assuming you are trying to shoot a colorful, evenly lit image. If you’re going for a moody, dark image or silhouette, you’ll want more peaks to the left. If you want a light and airy photo filled with bright sunlight, you’ll want more peaks on the right-hand side. But, looking at the histogram offers a quick glimpse as to whether or not you’ve successfully captured an evenly lit image, a dark one or a light one — and if that’s not what you intended, gives you a chance to fix the issue.
Step 4: Check the Contrast
Just how wide those peaks are indicates the contrast of the image. Peaks that gain height quickly have a low contrast scene while peaks that slowly build from the edges indicate a high contrast scene.
Again, whether or not you choose to make adjustments based on this information depends on the look you are going for — soft beauty lighting will have less contrast than a dramatic portrait with hard light. What the histogram does is show you whether or not you really achieved that goal so that you can adjust the lighting or camera settings as you shoot.
The histogram can help guide your camera settings in the field as well as influence which adjustments you make in post processing — but only if you understand how to read one first.
Looking for a great resource guide to round out your post processing? Check out our Complete Guide to Post Processing.
Want to learn more Photoshop tutorials, techniques and tricks? Learn all the best shortcuts today.